there are endless examples of stocks doubling and more over periods of ........
2 years ........
5 years ......
i'm tellin' ya, if you look at some of these examples, you'll see ...... well, i'm not tellin' ya that, but i think this is what you'll see ....... lots, for example, that were down, and then went up fast ..........
there's always this question of risk ......... but, if you're a working person, and pick, let's say, a likely looking stock that's down ........... one every month .......... and put a hundred dollars in it ............. and then hold on for ............ even just a double .............. you'll do well
that's my advice for the working person ........... and you're entering an area of risk, here, so don't put more than $100 a month into this system ............ until you know more! ........... because the system is as described ............ in about ten words ........... or twenty, anyway .......... in poetry, no less! .......... and put the rest of your savings ............ save more! .............. save, save, save! ......... into some other system ............. like an index fund
but, i will also say this
if you want to be systematic about
research
you can go to finviz.com
run a scan with no criteria
and get a list of 7000 stocks
and then you can look at
a history of each stock
which is called a chart
looking at 7000 charts
will take you a year
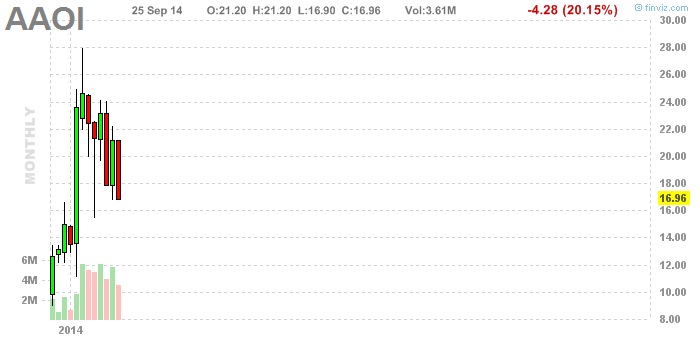
but if you look at monthly charts
what you're looking for is a stock
that recently doubled
in one month
so the month's low will be, say, $5
one month
and the month's high
that same month
was $10
what you're seeing
when you see that
is exceptional performance
so, what was happening
just before that terrific month?
how do you even talk about that?
sooooooo ....
i looked at
i would say
a half dozen charts
and then i found one
that doubled
in a month
in 2014
a new issue
i think that's what it means
that there's very little history
and i've been noticing
i think
that new issues are volatile
(so i guess that's why they're
something to think about)
sometime in February
presumably at the beginning of February
aaoi traded under $12 a share
and
presumeably later in February
it traded at $24
it doubled in February
there's no long term pattern to look at
this is the daily chart
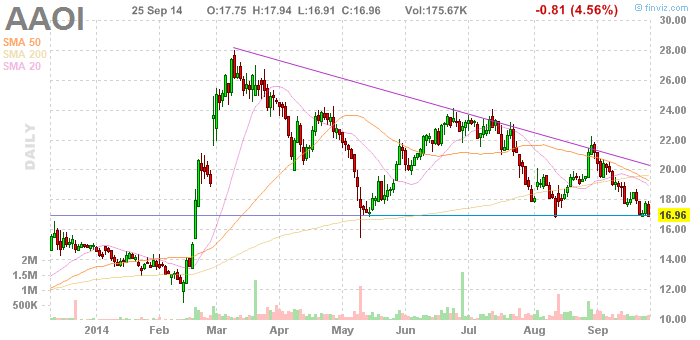
is there something in this chart that's worth noting? it was a new issue thus, with the potential to be volatile probably already a decent size company because finviz stocks all trade actively and then it went down for a month in several little steps down in several little steps down in several little steps question number 1: a hint? a clue? question number 2: do you think this says it all?