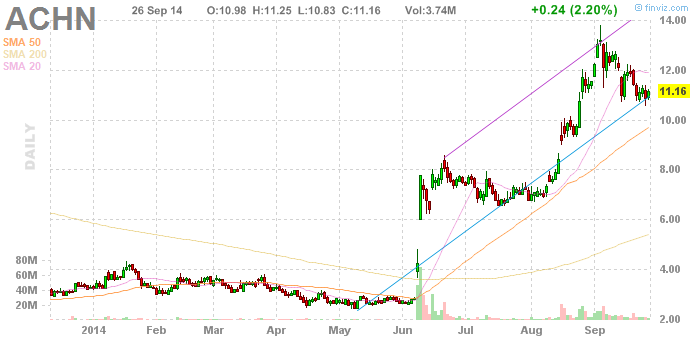
obviously, this is the kind of event we want to be, so to speak, a part of, buying in May, selling, sort of, any time. an interesting question is, are we looking at the beginning of a long term move that we should stay a part of?
the whole period from October to May is a canyon bottom pattern. for obvious reasons, we want to study the history of canyon bottom patterns.
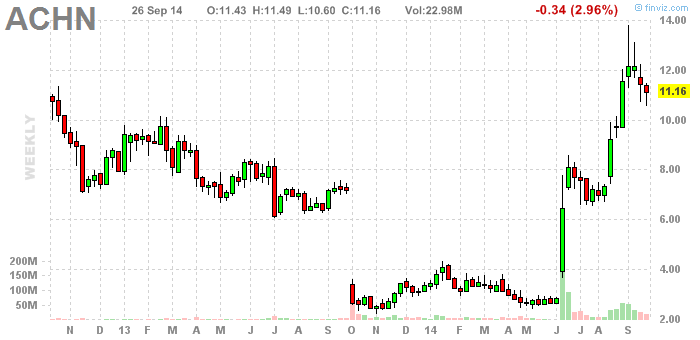
this, above, is an updating chart, so we can assess, going forward: with prices approaching a major long term top (but not the long term high price, yet), in September, 2014, (the 26th), is it a sell, or is it the beginning of a much bigger rally?
canyon bottom pattern.
long term bottom? (with tops at $15)
long term bottom?
long term bottom? it's still going down ... but ... well, anyway, a target around $20 is the limit, and it won't stay up there for long ... but ... sketchy ... but ... attractive because of the upside
easy to find these ... cheap looking stocks ... hard to tell how long they'll take to go up ... impossible to know for sure they will ... but likely some of them will go up quite a lot, to their targets ... putting $100 in each of several ... then, for God's sake, watching them ... is sort of the plan
looking the above over, my favorite (September 27, 2014) among the above maybe bottoming stocks is ACTS. Actions Semiconductor, a fabless manufacturer, good revenue trend with over $50 million in sales last year, very good price/book ratio. OK.
cheap in the $5 area, September 27, 2014
cheap to go to $20, might come down to $5
cheap at $1 to double, a little iffy, though
good to double, from $8 to $16, September 27, 2014
good to triple from 30, might go down to 20, though, September 27, 2014